Tree Datalize
Educating the economic and environmental benefits of trees
We met the representative from TreeDavis on the first day, and in our conversation with him we could see how motivated he was towards making our lives better by planting more trees. The talk was very informative and we decided that we could help the organisation's goals by helping make people more aware of the trees around them and the impact they have.
What it does
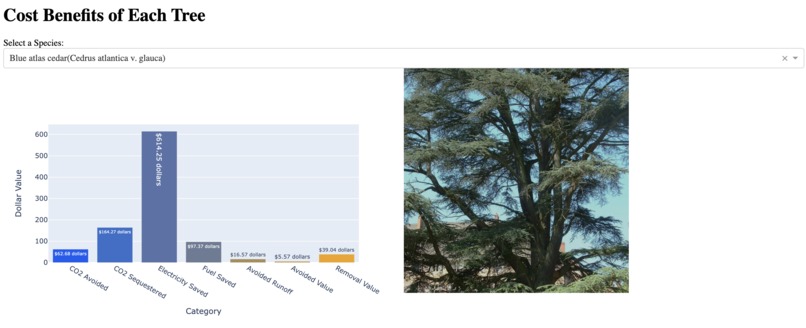
The first visualization provides a comprehensive depiction of the cost benefits associated with planting specific trees. By presenting relevant data and information, this visualization showcases the financial advantages that can be gained through tree planting initiatives.
It offers a clear and visually appealing representation of the economic benefits derived from planting different types of trees, taking into account factors such as maintenance costs, energy savings, property value increase, and potential revenue generation. With this visualization, viewers can easily grasp the monetary value and long-term advantages of investing in tree planting projects.
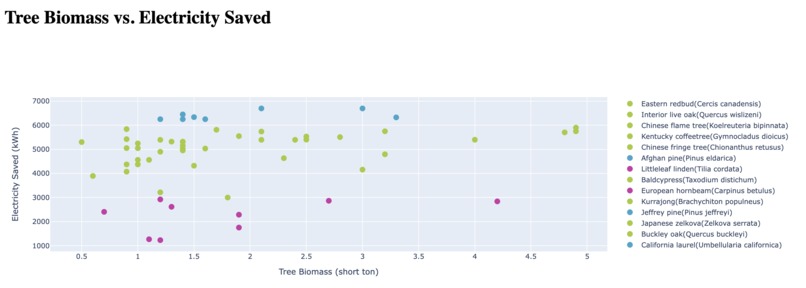
The second visualization focuses on highlighting the correlation between the size of trees and their potential to save electricity. By visually illustrating this relationship, the second visualization offers valuable insights into the energy-saving capabilities of various tree sizes.
Through data analysis and visual representation, viewers can observe how larger trees possess a greater capacity to provide shade, which in turn reduces the need for air conditioning and overall energy consumption. This visualization aims to raise awareness about the environmental benefits of planting and preserving large trees, showcasing their positive impact on energy efficiency and electricity savings.
Development Process
Before building the application, we asked for any databases that TreeDavis uses and decide to the same one. We queried that database for all the relevant tree data the City of Davis, Yolo County, and extract that data into a .csv file. Then, we cleaned that data with pandas and other data science-related packages in python. After which, we used Dash and Plotly to build the visualization and front end of our application. We then hosted the data app with Flask and a free hosting service through PythonAnywhere.
What I Learned
These past 24 hours have been an impactful learning process. We've exercised team work, time management, and design and development skills; from learning in the workshops to applying those lessons into our product.
Improvement Room
In the future, TreeDatalize can be further fleshed out into a fully functioning website.